Smooth Criminal: Reducing Crime in Communities (Part 1)
Criminal. Even the phonics convey a clear, consonant surface that masks an undercurrent of smooth, coordinated strategy. Public perception of crime has been sculpted by tactical storytelling, from the Disney villains to the grisly serial killers of SVU. The collective story of crime has been carefully formed and upheld, and what typically comes to mind when we think of a “criminal” is a person who has committed an outlier offense – murder and assault are far less common than other forms of crime, despite what CSI may have you believe.
Yet, many Americans live with the daily fear of violence and assault (though not always from the people you might expect), and this fear guides our decision-making in significant ways. Decisions about political representation (and subsequently public spending) can be significantly influenced by fear, and understandably so! If you’re living with the constant fear of violence, certainly you’d want to support policies and budgets that may help reduce that risk.
For some, this means bolstering law enforcement. For others, law enforcement is one of the biggest threats of violence.
Whether we’re aware of it or not, our perception of “crime” is a central character in the political story, so it’s worth exploring. In this three-part series, we will examine how we measure and define crime, what has been found to cause crime, and evidence-based prevention strategies that we can support to help reduce crime in our own neighborhoods.
How do we measure crime?
The common narrative these days is that criminal activity as a whole has increased. We see this plot presented across nearly all engagement platforms, especially within news, entertainment, and social media. In particular, news media distorts the prevalence of certain types of crime (as well as who commits these crimes), which leaves people with an inflated sense of risk.
Is this media story of ever-increasing danger based on true events? The answer depends on how we define crime itself, and the methods that are used to track its prevalence.
Often, we think of extremes when it comes to crime. Pop culture has ingrained in us the idea that crime is strictly gruesome and granular, largely without reason or purpose. But, most crime is technically classified as nonviolent.
Violent crime is defined as any crime in which “a victim is harmed by or threatened with violence.” These crimes include rape and sexual assault, robbery, assault, and murder. When we hear the word “crime” we typically think about violent crime – partially due to the emotional power it holds, and partially because this is the most common depiction in popular media.
But, there is a classification of crime that sees rates that are more than double (some years even 5 times higher than) those of violent crime: property crime. Property crime is defined as any crime in which “a victim’s property is stolen or destroyed, without the use or threat of force against the victim.” These crimes include burglary and theft, as well as vandalism and arson.
These are two of the major categories of “street crime” that are reported and tracked (along with drug crimes, hate crimes, and human trafficking, which are not included in this discussion). The most reliable (and theoretically impartial) estimates of crime in the U.S. come from the FBI’s Uniform Crime Reporting (UCR) Program, which collects data from 18,000 city, university and college, county, state, tribal, and federal law enforcement agencies that voluntarily participate in the program.
The key word here is “voluntarily” – this means the data will be inherently biased, as the collection relies on law enforcement groups self-reporting crimes in their area. If there is any kind of incentive for reducing crime (such as budget concerns), there is plausible reason to suspect that departments may underreport or elect not to report data for their region.
However, for the sake of understanding the data that are available, let’s assume these reports are largely comprehensive.
While violent crime is more attention-grabbing (and more commonly the root of widespread fear), property crime rates are significantly higher. Here is a chart depicting the rates per 100,000 people of each type of crime, from 1960-2014:
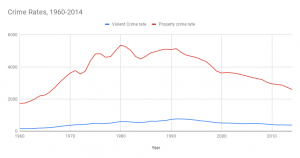
You can clearly see that property crime rates are much higher than the rates of violent crime, and that both types of crime begin to taper off after 1990 – we’ll explore why in part two of this series.
Ultimately, despite what it may feel like in the world today, and despite the narrative that Hollywood and the media like to tease, violent crime and property crime are actually on the decline.
Another plot that has been touted lately presents law enforcement itself as victims of criminal intent. Citizen violence against police officers is an undeniable problem – just as any violence against anyone is an undeniable problem. In the wake of the rapid expansion of Black Lives Matter support, many law enforcement agencies have come forward with stories of their own victimization, and these stories, just as any other human story of suffering, deserve recognition.
Violence and aggression toward police is not new, nor is it any more or less extreme than violence committed against non-police. But, is it true that crime against law enforcement has increased?
For this, we have to look to the Law Enforcement Officers Killed and Assaulted (LEOKA) Program, which is part of the FBI’s UCR Program. From this dataset, we can piece together this chart, depicting total officer deaths from 1996-2019 (both felonious, meaning a person killed them, and accidental, meaning the officer died unintentionally, such as in a car accident):
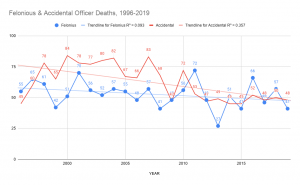
While accidental officer deaths have seen a much larger decline, both types of officer deaths have a downward trend. Fear tends to believe that violence against law enforcement is getting worse, yet the data indicate that it is ultimately declining.
With that said, this year has been particularly contentious between citizens and law enforcement. The violence between these groups has always existed, but obviously situational differences will create drastically different circumstances for aggression and violence. We have yet to see how 2020 will differ from, or possibly fit, these trend lines.
Citizen-committed acts are the typical face of what we consider “crime.” But, there are myriad other methods of criminal activity that often get overlooked, despite having significant consequences.
Consider corporate crime (also known as “white collar” crime), which inflicts more harm on society than all street crimes combined. Or even government “crime,” where drone strikes enact mass murder in a matter of minutes. Often, when we think of crime we limit our concept to the interpersonal level, yet these broader categories, which often get omitted from the conversation, have a much wider breadth of impact.
We cannot have a complete conversation about crime when excluding an entire range of high-impact criminal activity simply because it feels distant to our own situation. One of the biggest factors that play into this willful ignorance is fear itself: the fear of being killed, assaulted, or robbed is much more tangible to the everyday person than the fear of the trickle-down impact of corporate fraud or the impact of military violence (especially when the U.S. has never known international war on their own soil).
This inherent bias toward overestimating the familiar (also known as the “availability bias” in psychology) also leads to perception issues when it comes to other types of local crime. There is a terrifying form of violence and murder that is frequently neglected when discussing crime, and often passes without justice for the victims: police-committed violence. If a person has never experienced firsthand the violence of law enforcement, they will perceive this kind of crime through a biased lens, struggling to believe that it is a true problem. But, the data don’t lie.
The FBI has been tracking police-committed killings since 2013 in their National Use-of-Force Data Collection (also part of the UCR Program). This database is populated with data that are voluntarily shared by law enforcement agencies throughout the U.S. The FBI has no legal authority to mandate reporting, so it is up to the individual departments to decide whether or not to share their use-of-force data – an obvious (and disheartening) bias with clear incentives for withholding information. Still, at least 1 department from each of the 50 states has participated at some point in the data collection, accounting for 41% of sworn officers in the U.S.
Again, let’s temporarily suspend suspicion and assume the data are complete. Here is a chart depicting the total number of police-committed killings reported from 2013-2019:
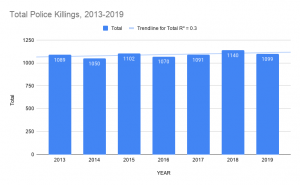
You can see a slight upward trend line, but it is painfully clear that the numbers have not declined. Now, it’s fair enough to suggest that these police-committed murders have been in a situation of self-defense – police have a dangerous job. So, to get a better idea of the proportion of these murders that were likely unjustified (by traditional standards), we can filter by whether or not the victim was armed at the time that they were killed by police. This paints an interesting picture:
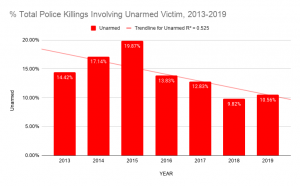
The proportion of police killings that involve an unarmed victim seems to be declining overall. In that case, why are certain communities protesting while others remain silent? There’s another factor that plays into this painting: race. Here is a chart depicting the percentage of unarmed victims of police killings that were white vs. non-white:
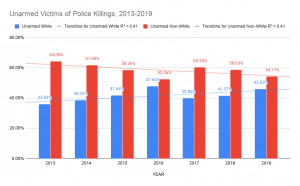
The trend lines for unarmed white victims and unarmed non-white victims seem to be ready to cross one another, moving toward closer alignment with the actual population proportions. Remember that these numbers examine ALL non-white victims compared to white victims, and white people account for 76.3% of overall population (2019), yet only reflect 46% of unarmed victims of police killings in 2019.
Police murder of unarmed victims is clearly disproportionately affecting non-white people, which is likely why most calls for justice surrounding police-committed violence arise in non-white communities – they see this kind of violence at a disproportionately high rate. If a person does not personally experience the same degree of police violence, they will tend to believe that law enforcement brutality and murder are not a problem and thus, not a crime.
Fear and familiarity with different types of crime will affect our perception of how “bad” the crime itself actually is. We consider the more familiar acts as more criminal, yet this distinction is deeply flawed. All of these acts are criminal: property crime, violent crime, corporate crime, government crime, citizen-on-officer crime, and officer-on-citizen crime – not to mention all the other types of crime that we didn’t even touch on.
How do we currently measure crime? Using biased self-reporting from the very law enforcement agencies that may have incentive to misrepresent their statistics. Still, clear patterns emerge when we look at the data: violent crime, property crime, and violence against law enforcement are on the decline, while police-committed killings remain stable.
How do we currently define crime? By relying on our fear and familiarity biases rather than examining the data that are available (as potentially biased as they might be). Fear is often our guide when deciding what we consider “criminal” or not, even when the breadth of impact is wider for less-familiar forms of crime.
Our inherent biases lead us to believe that certain types of crime are increasing simply because we hear about them (or witness them) more often, and this leads to ineffective policy making and impractical voting decisions that are based solely on fear rather than facts.
In the second edition of this three-part series we will build upon this understanding of crime to examine factors that impact crime rates and the causal roots of criminal activity (hint: it’s not all committed by moral-less serial killers).
